
In lean production, an Andon board visualizes current and relevant key figures for employees and managers. This can happen at the point of value creation, but also in offices. This keeps management in touch with Gemba. With oee.ai, an Andon board can be installed anywhere in the factory in just a few simple steps and at low cost.
Andon board as a management tool
Andon is a method of visual management and part of the Toyota production system or lean production. An Andon board should be simple and self-explanatory and provide support for process control.
Taiichi Ohno, the founder of lean philosophy, describes the Andon system as follows in his book “Toyota Production System” published in 1978:
“When one looks up, the Andon (the line stop indication board) comes into view, showing the location and nature of trouble situations at a glance.”
Over time, Andon has increasingly developed into an information board for all employees involved in the process. Status information regarding the current production situation, such as the number of units produced per day or per hour, the level of delivery reliability to the customer or the cumulative amount of backlog, is displayed on the board. In this way, all process participants are aware of the current situation — and can act accordingly.
Andon on OEE visualization
This is where oee.ai comes in. With oee.ai sensors installed, any standard television or computer display can become an Andon board with a small additional box. The only requirement is that the device has an HDMI connection and that it is located in the coverage area of a WLAN.
The small additional box is connected once to the local WLAN and connected to the display via an HDMI cable — and after a few simple steps, the Andon signal is displayed. The additional box is configured in such a way that it covers its power requirements from a USB port on the display. As a result, no additional power supply is required and the additional box automatically boots up when the display is switched on. A so-called kiosk mode prevents unwanted misconfigurations from being carried out.
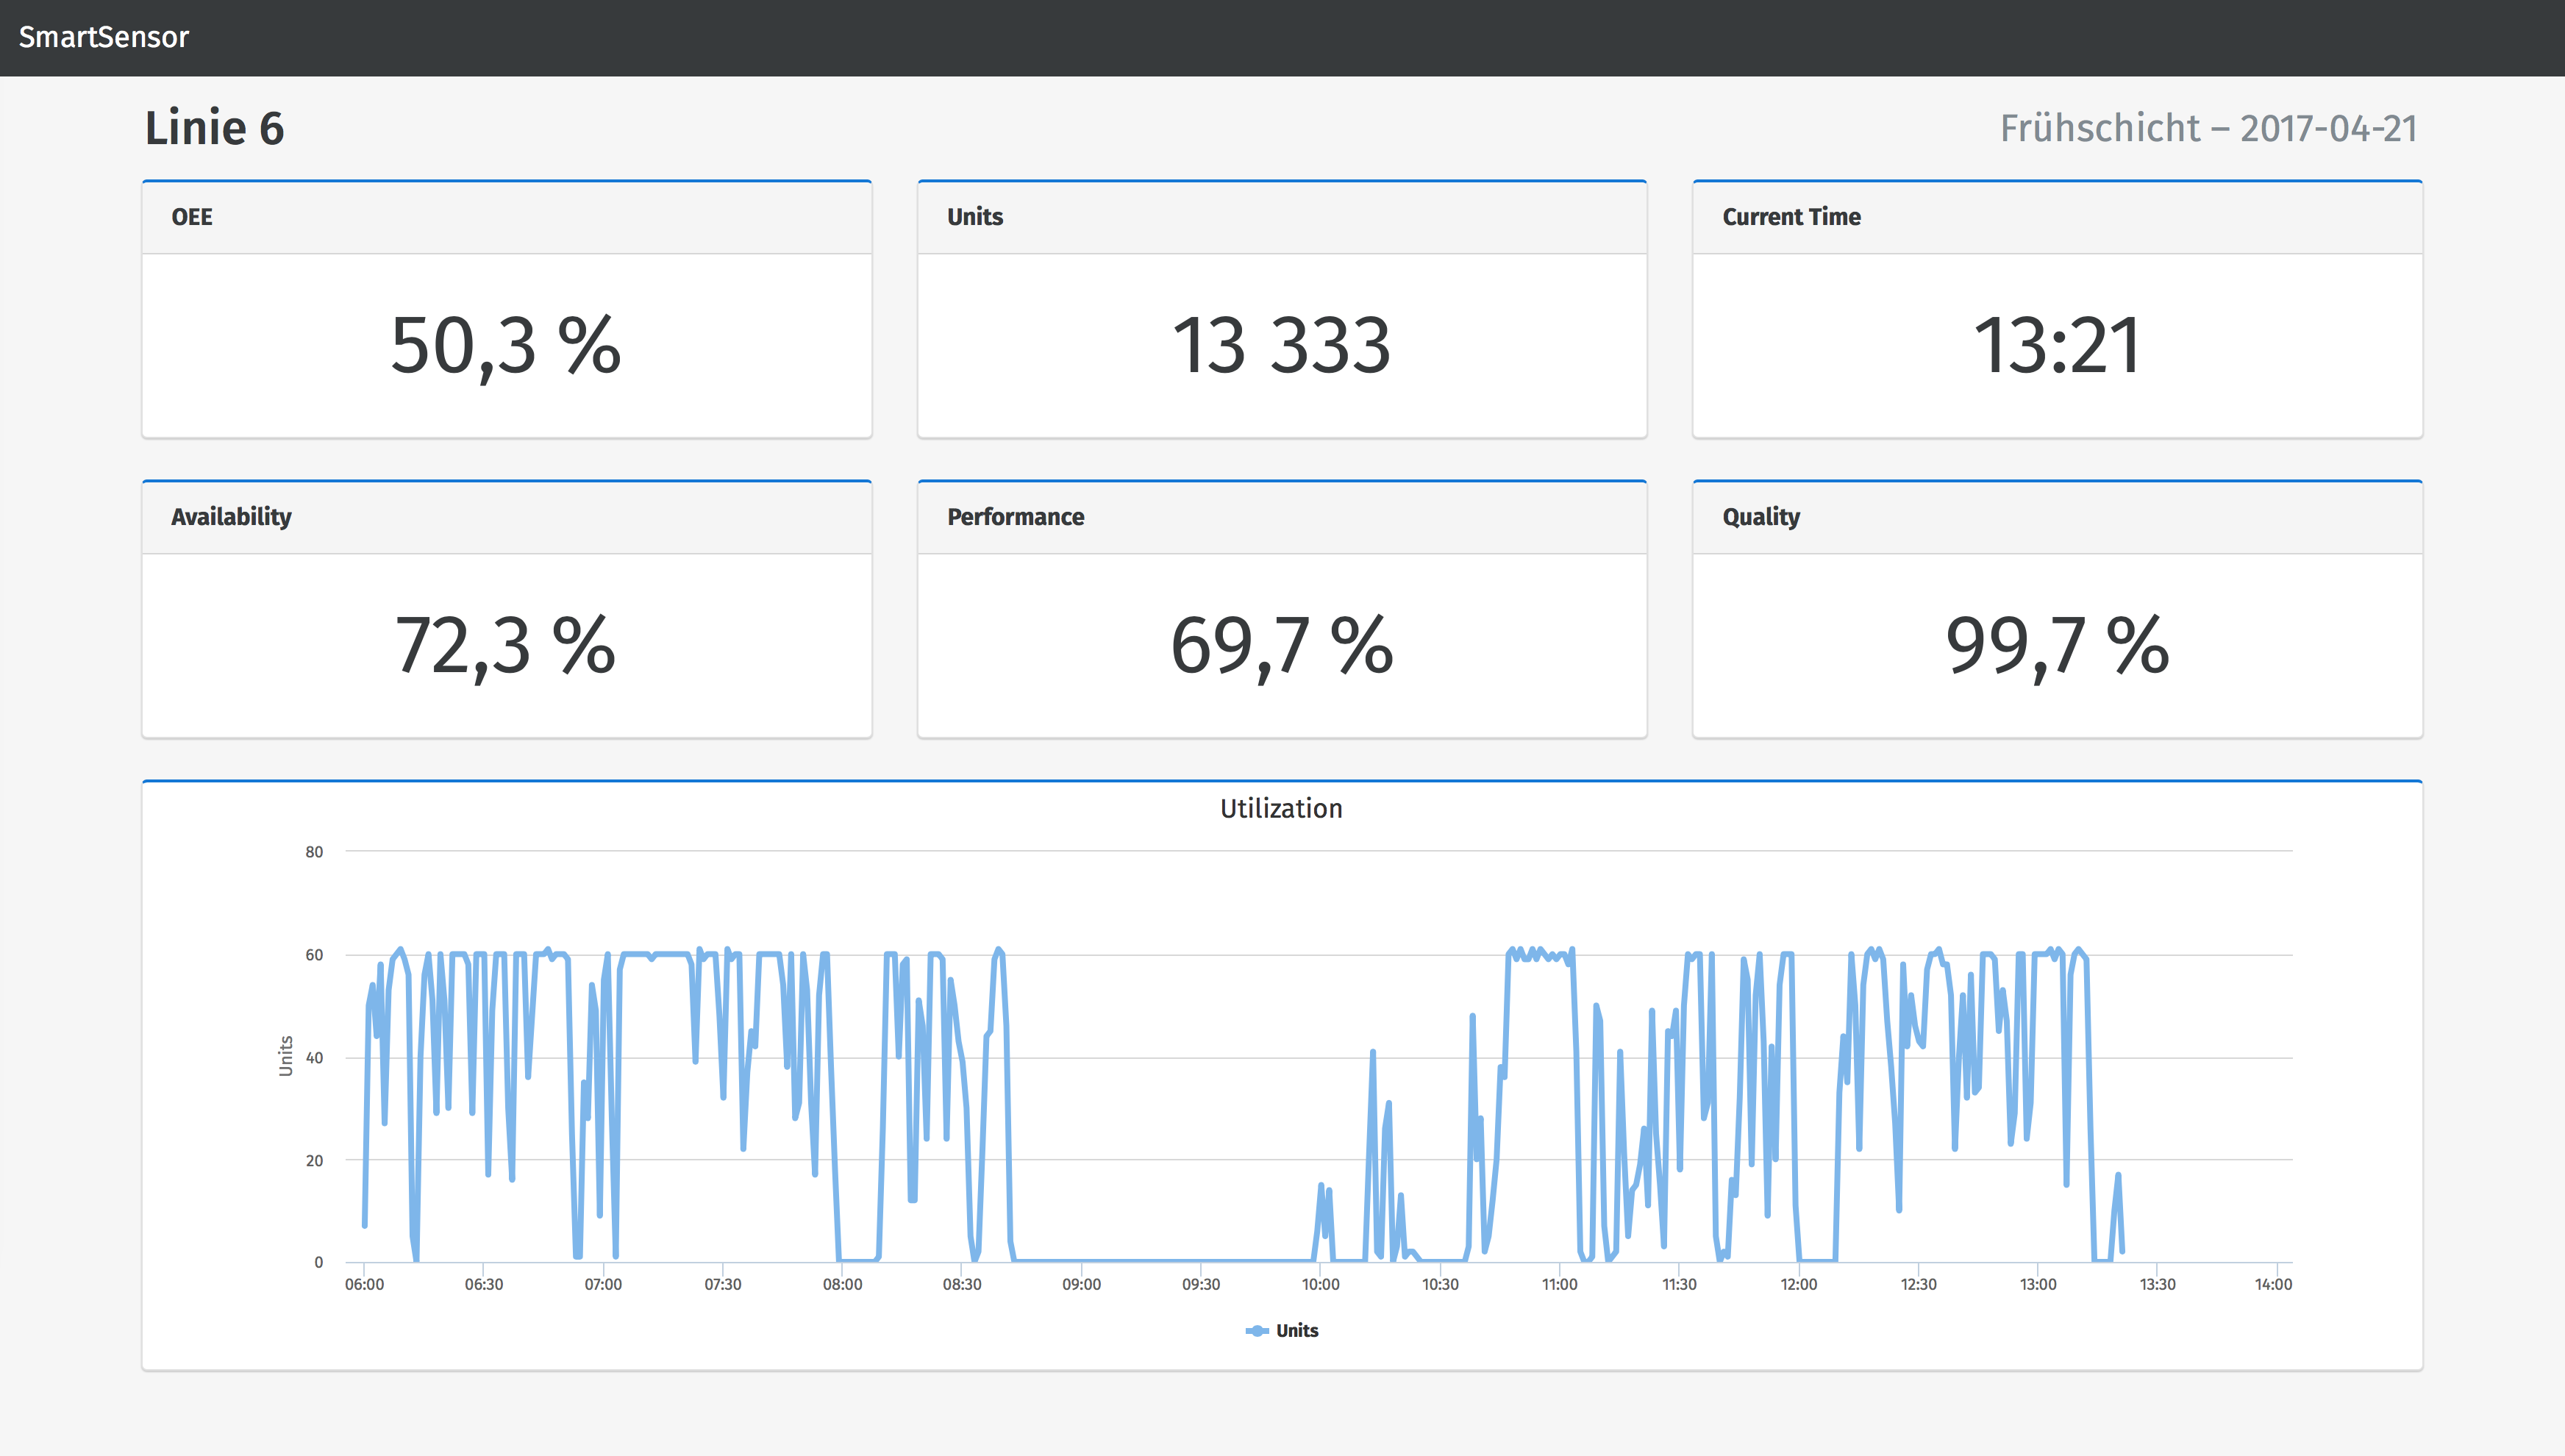
In this way, the following information is delivered to every location:

Picture: Example of an Andon board for OEE visualization
In addition to the key figures in the upper area, the lower half of the display visualizes the process flow over the shift. This makes it easy for managers, for example, to assess the stability of the process or the length of downtimes ad-hoc and visually without relying on subsequent reports.
What now?
We've sparked your interest. Contact us at info@ifp-aachen.de or call us: +49 (0) 241/401 842 75. We will be happy to provide you with oee.ai sensors, access to the analysis cockpit and an Andon box free of charge for a test period. Only then do you decide. We're easy at this point too!