
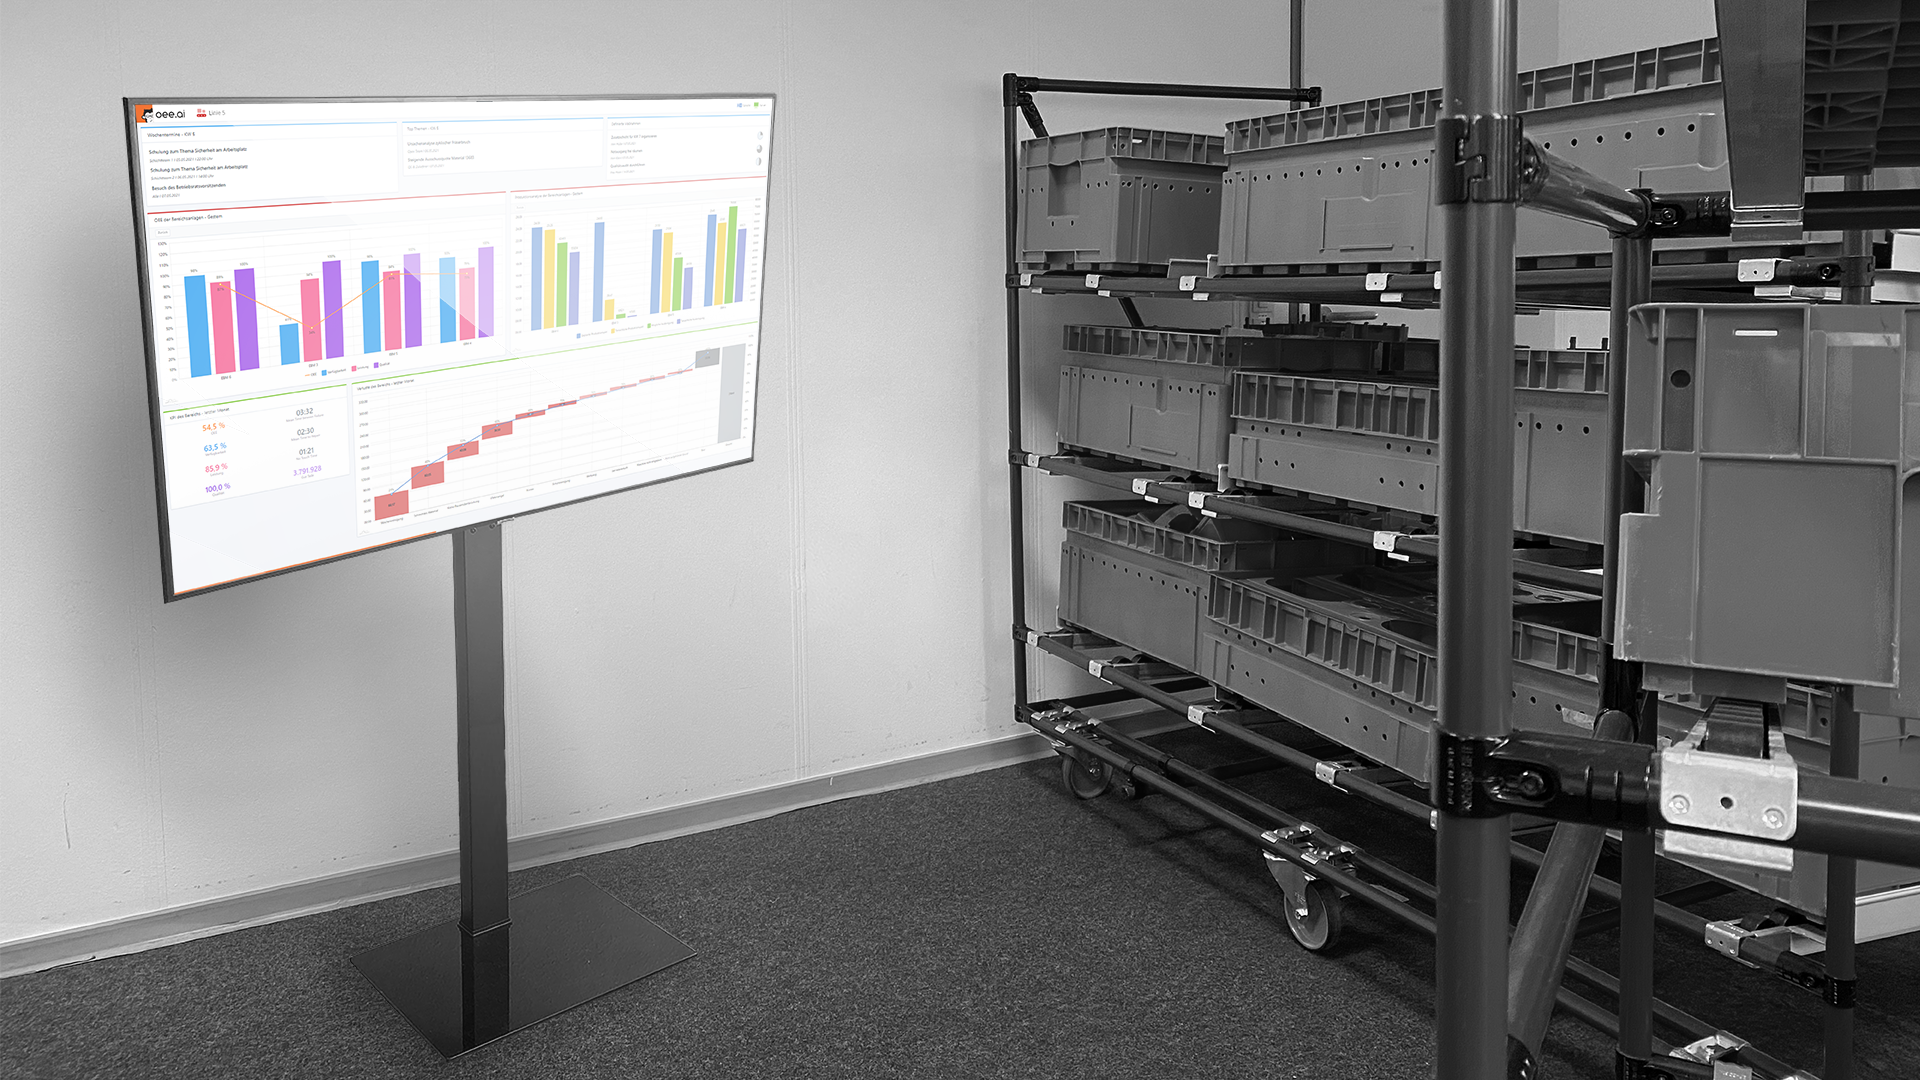
In lean manufacturing, an Andon board visualizes current and relevant key performance indicators for employees and managers. This can take place at the point of value creation or in the office. It helps management stay connected to the Gemba. With oee.ai, an Andon board can be installed anywhere in the factory with just a few simple steps and at a low cost.
Andon board as a management tool
Andon is a visual management method and a core component of the Toyota Production System and lean manufacturing. An Andon board should be simple, self-explanatory, and serve as a support tool for process control.
Taiichi Ohno, the founder of the lean philosophy, described the Andon system in his 1978 book, "Toyota Production System," as follows:
“When one looks up, the andon (the line stop indication board) comes into view, showing the location and nature of trouble situations at a glance.”
Over time, Andon has increasingly evolved into an information board for all employees involved in the process. The board displays status information regarding the current production situation, such as the number of units produced per day or hour, the level of delivery reliability to the customer, or the cumulative backlog. This ensures that everyone involved in the process is aware of the current situation and can act accordingly.
Andon for OEE visualization
This is where oee.ai comes in. With oee.ai sensors installed, any internet-enabled TV or computer display can become an Andon board. This brings the following information to any location:
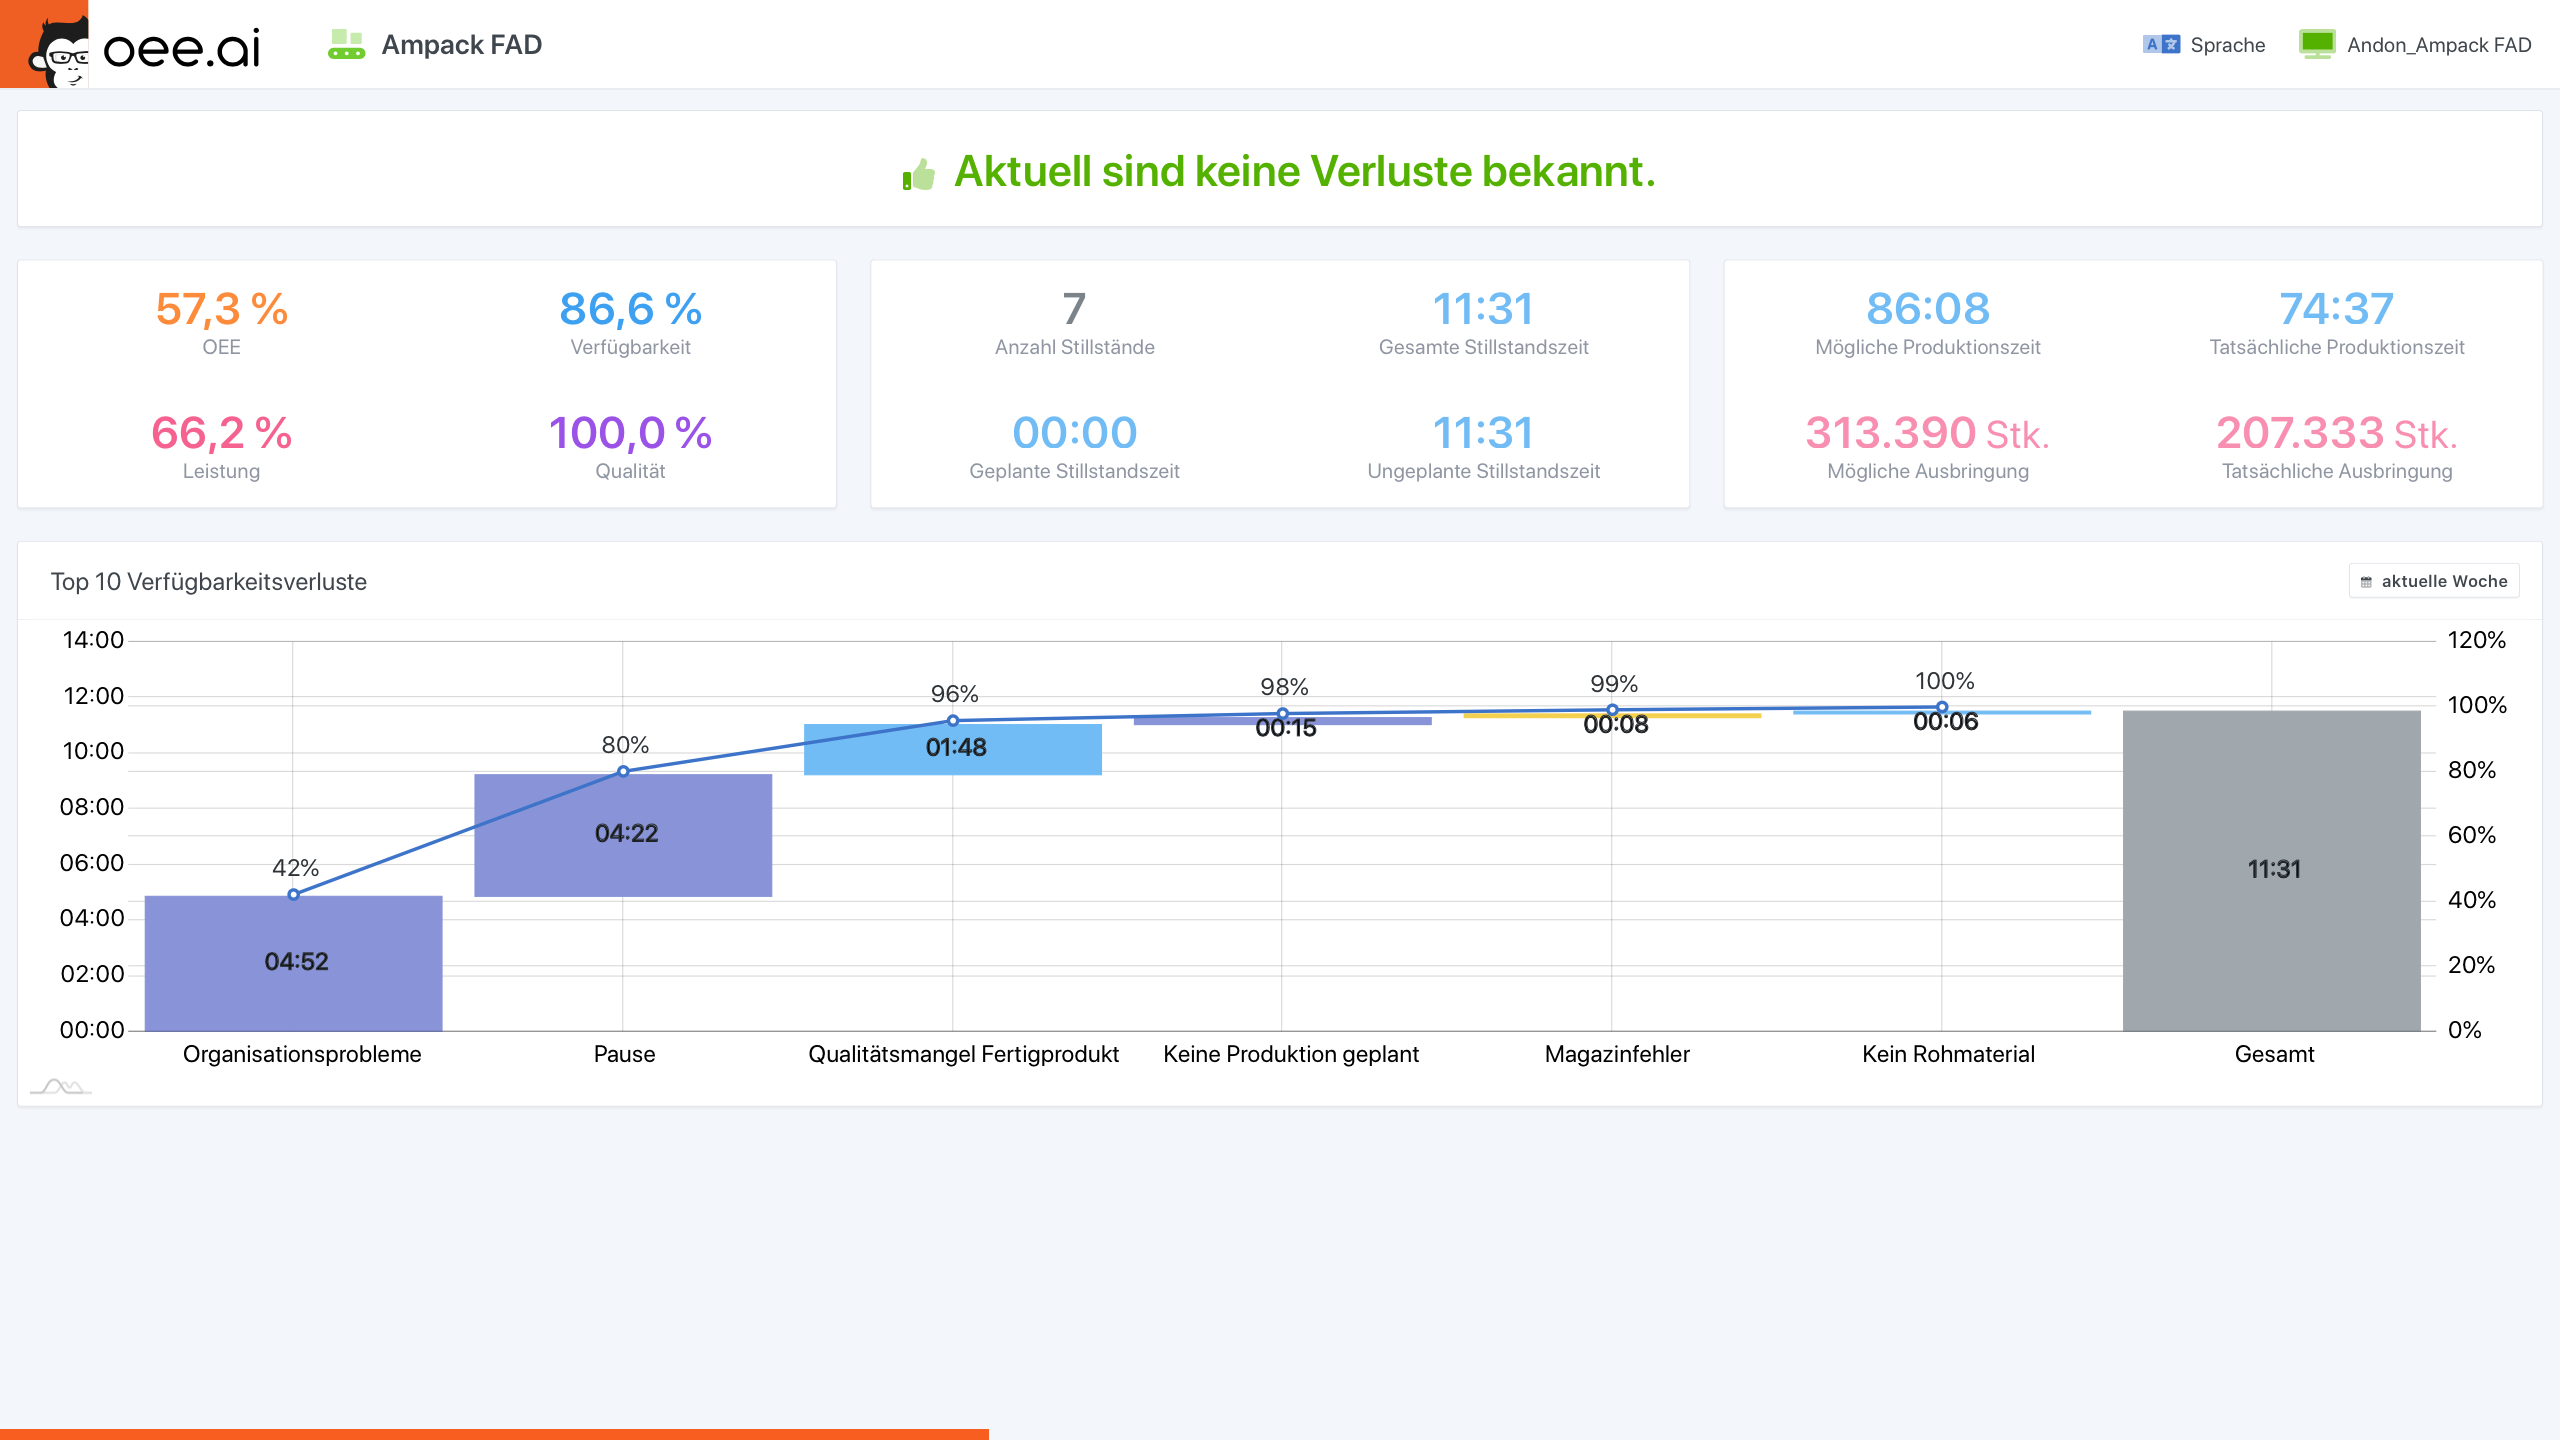
The board shows at a glance how the machine has performed during the current week. At the very top is the current status – in this case, a notification that there are currently no open losses.
Below that are the key figures: OEE 57.3 percent, broken down into availability 86.6 percent, performance 66.2 percent, and quality 100 percent. Next to this are the downtimes – seven events totaling 11:31 hours, all unplanned. On the right is the comparison of target versus actual: 86:08 hours of potential versus 74:37 hours of actual production time, and 313,390 versus 207,333 potential versus actual units produced. The Pareto chart below answers the crucial question: Where is the time going?
Organizational issues at 4:52 hours and breaks at 4:22 hours together account for 80 percent of availability losses. Everything else – quality defects, missing raw materials, magazine errors – is negligible in comparison.
That is exactly the point of an Andon board: it doesn't just tell you that the OEE is at 57 percent; it shows you in the same view which two areas are worth focusing your efforts on.
What now?
Interested? Contact us at info@oee.ai or give us a call at +49 (0)241/401 842 75. We would be happy to provide you with oee.ai sensors and access to the analysis cockpit for a trial period. You only decide afterwards. We like to keep things simple!