
Calculating OEE: formula, example and types of losses
OEE (Overall Equipment Effectiveness) combines a machine's availability, performance and quality losses into a single key figure. This makes it possible to analyze how much of the planned production time actually resulted in good parts and where the losses occur.


OEE formula: availability, performance and quality
OEE is made up of three factors, each representing one type of loss. Multiplied together, they give the OEE:
OEE = availability level × performance level × quality level.
Availability level
Actual production time ÷ planned production time. Measures how long the machine actually produced during the planned time. Losses are downtimes.
Performance level
Actual output ÷ possible output. Measures whether the machine ran at its target speed while it was running. Losses are reduced speed and short stops.
Quality level
Good parts ÷ actual output. Measures what share of the parts produced was in order. Losses are scrap and rework.
Example: calculating the OEE of a machine over 24 hours
A machine is available for 24 hours. Of these, 22.5 hours are planned for production, and it actually produced for 21 hours. The target speed is 1,200 pieces per hour. So in 21 hours, 25,200 pieces would have been possible. 21,800 pieces were produced, 21,146 of them good parts.
1
Availability: 93.3 %
21 hours of actual production time divided by 22.5 hours of planned production time.
2
Performance: 86.5 %
21,800 pieces of actual output divided by 25,200 pieces of possible output.
3
Quality: 97.0 %
21,146 good parts divided by 21,800 pieces of actual output.
4
OEE: 78.3 %
93.3 % × 86.5 % × 97.0 % = 78.3 %. In this example, the biggest lever is performance, not downtime.
The OEE waterfall
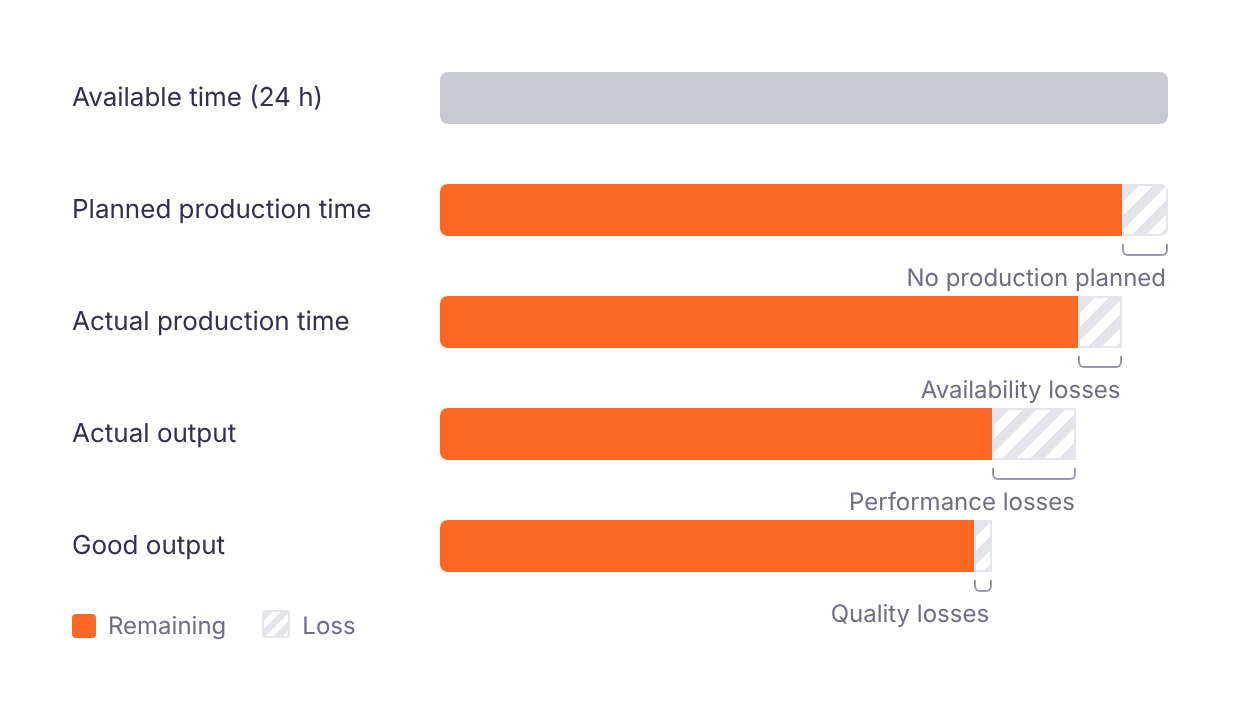
The waterfall makes it possible to trace where and how much is lost. Starting from the available time, the unplanned time and the availability, performance and quality losses are deducted one after the other. What remains are the good parts.
You can also get the same result directly: good parts divided by the quantity that would have been possible in the planned production time, i.e. 21,146 ÷ (22.5 h × 1,200 pieces/h) = 78.3 %.
The most common causes of losses
Typical causes that occur particularly often in production can be assigned to the three OEE factors. With availability losses, the machine is at a standstill even though production was planned. With performance losses, it runs slower than specified. These losses are harder to spot than a standstill, but often just as large. With quality losses, not every part produced is in order.
What is a good OEE? Putting the value into context
General benchmarks such as “80 % OEE is world class” are of little help in individual cases, because the level of OEE depends heavily on the specific machine. Comparing a machine with itself over different periods is more meaningful.
As a rule of thumb, values below 30 % point to weaknesses in machine operation. Between 30 and 50 % is common for machines whose OEE has not been measured before. Strong fluctuations between shifts, days or weeks point to differences in the process that can be eliminated.
Degree of automation of the machine
Batch size
Complexity of the machine
Skill level of the operators
Further key figures
Further key figures related to OEE
Besides OEE, there are other key figures that can be used to analyze the productivity of a machine.
Utilization rate and TEEP
The utilization rate relates the planned production time to the maximum possible time. TEEP (Total Effective Equipment Performance) is the OEE multiplied by the utilization rate. In the example, the utilization rate is 93.75 % (22.5 h ÷ 24 h) and the TEEP is 73.4 %.
Machine OEE and Production Order OEE
Machine OEE looks at a fixed period, such as a shift or a week. Order OEE refers to a production order and is useful when different products, recipes or filling sizes run on one machine.
MTBF, MTTR and No Touch Time
MTBF (Mean Time between Failure) measures the stability of the process, MTTR (Mean Time to Repair) the time it takes to fix a fault. No Touch Time measures how long the machine produces without intervention.
Technical availability
Technical availability according to VDI 3423 indicates the share of the occupancy time in which the machine is available without technical failure. Because of how it is calculated, it is usually much higher than the availability level of the OEE.
Analyze losses with oee.ai
With oee.ai, you analyze where losses occur, prioritize measures and check their effect.
